
- 80.0LEGITIMACY SCORE
- 84.0SAFETY SCORE
- 4+CONTENT RATING
- FreePRICE
What is Fibonacci Stock Chart - trading signal in stocks? Description of Fibonacci Stock Chart - trading signal in stocks 3593 chars
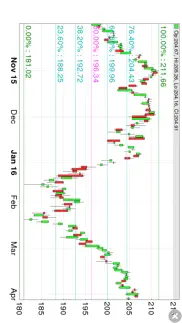
Fibonacci is very powerful. Traders never forget to check Fibonacci retracement chart before any swing trade. This app is a handy tool to quickly draw the Fibonacci lines on the chart based on the time range and direction (uptrend or downtrend) you choose. The lines are drawn automatically. You can certainly set your own range as well. All come with Real Time Advanced quotes (pre and after market quotes included), powerful Multi Chart View & Sector View, customized watch-list, stock notes, etc.
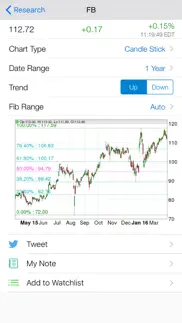
Fibonacci retracement on Stock Chart has never become this easy! Just enter the ticker symbol (or a partial symbol) you desire and bingo! you are there! A neat stock chart with Fibonacci lines and various Chart Types and Date Ranges is specially presented. Choose different type, date range, Fibonacci trend & range, you will have a better read / analysis on your stock. Tap the chart to view an enlarged full screen chart.
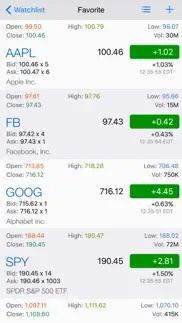
What's more, this app offers a very nice watch-list feature. You can create and manage unlimited watch-lists. The powerful watch-lists allow to group contents into Charted Sector View and exhibit a LIST of fully customized Charts (Multi-Chart View)! Adjust the technical indicator, chart type, and date range for the Multi Chart View and the app will automatically remember your settings. Create, modify, rename, sort, and delete watch-lists within seconds. With one glance, not only can you get the whole picture like change, change %, bid, ask, bid size, ask size, OHLC, volume, company, etc, but also quickly access the fibonacci lines / charts from there. Watch-list is so convenient that your market watching and researching become well organized and efficient.
FIBONACCI CHART
———————————
■ Fibonaaci
▫ Uptrend
▫ Downtrend
▫ Auto Range
▫ Customized Range
■ Real-Time Advanced Quotes
■ Pre and After Market Quotes
■ Various Chart Types.
■ Various Date Range, pre-set and customized.
WATCH-LIST & RESEARCH
——————————————
■ Unlimited watchlist groups with colorful tags
■ Real Time Advanced quotes (change, change %, bid, ask, bid size, ask size, open, high, low, close, volume, company).
■ Pre and After market quotes
■ Auto Refresh Quotes
■ Stock Multi Chart View 40+ Technical Indicator, Chart Type, & Date Range
■ Add multiple stock symbols at one time.
■ Group watchlist symbols into Sectors and Pie Chart.
■ Multi Chart View (up to 50 charts) of stocks.
■ Stock Notes
■ Passcode / Touch ID protected app access
TECHNICAL INDICATOR
——————————————
■ Accumulation/Distribution
■ Aroon Up/Down
■ Average True Range
■ Bollinger Band Width
■ Chaikin Money Flow / Oscillator / Volatility
■ Donchian Channel Width
■ Ease of Movement
■ Fast Stochastic
■ MACD
■ Money Flow Index
■ On Balance Volume
■ Performance
■ % Price / Volume Oscillator
■ Price Volume Trend
■ RSI / StochRSI
■ TRIX
■ Volume
■ and MANY MORE...
CHART TYPE
———————
■ Candle Stick
■ Based on close price
■ OHLC (open, high, low, close)
■ Based on typical price
■ Based on weighted close price
■ Based on median price
DATE RANGE
———————
■ Past 5,4,3,2 day & current day.
■ Daily chart supports 1-month, 2-month, 6-month, YTD, 1-5 years & MAX available date range.
■ Daily chart also supports customized date range: choose any date range from the calendar.
You can communicate with us through the In-App messaging system or to [email protected]
- Fibonacci Stock Chart - trading signal in stocks App User Reviews
- Fibonacci Stock Chart - trading signal in stocks Pros
- Fibonacci Stock Chart - trading signal in stocks Cons
- Is Fibonacci Stock Chart - trading signal in stocks legit?
- Should I download Fibonacci Stock Chart - trading signal in stocks?
- Fibonacci Stock Chart - trading signal in stocks Screenshots
- Product details of Fibonacci Stock Chart - trading signal in stocks
Fibonacci Stock Chart - trading signal in stocks App User Reviews
What do you think about Fibonacci Stock Chart - trading signal in stocks app? Ask the appsupports.co community a question about Fibonacci Stock Chart - trading signal in stocks!
Please wait! Facebook Fibonacci Stock Chart - trading signal in stocks app comments loading...
Fibonacci Stock Chart - trading signal in stocks Pros
✓ Usefulness ++++ Value +++++Valuable app for tech trader or fund trader seeking entry or exit points. suggestion: need weekly time frames between 5 days and 1 month..Version: 1.1.0
✓ Great little app!Great for a quick no nonsense look at retracement levels. Auto generated levels are a godsend.Version: 1.0.0
✓ Fibonacci Stock Chart - trading signal in stocks Positive ReviewsFibonacci Stock Chart - trading signal in stocks Cons
✗ ReviewThis app some of the time works. Needs some TLC back room changes and update. Other apps are far superior to this.Version: 1.4.0
✗ Needs to offer multiple range sets with confluence to be meaningfulThe app is ok but instead of having a default time range of exactly 6 months or offering customized value range (that we have to define), a far more helpful & meaninful solution would be to to have a clever data analysis that plots the Fibonacci for *multiple* ranges *automatically* and THEN highlights (&/or alerts) when area(s) of Fibonacci "confluence" arise. That's what's important to Fibonacci investors; not just one arbitrary time or value range..Version: 1.1.0
✗ Fibonacci Stock Chart - trading signal in stocks Negative ReviewsIs Fibonacci Stock Chart - trading signal in stocks legit?
✅ Yes. Fibonacci Stock Chart - trading signal in stocks is 100% legit to us. This conclusion was arrived at by running over 349 Fibonacci Stock Chart - trading signal in stocks user reviews through our NLP machine learning process to determine if users believe the app is legitimate or not. Based on this, AppSupports Legitimacy Score for Fibonacci Stock Chart - trading signal in stocks is 80.0/100.
Is Fibonacci Stock Chart - trading signal in stocks safe?
✅ Yes. Fibonacci Stock Chart - trading signal in stocks is quiet safe to use. This is based on our NLP analysis of over 349 user reviews sourced from the IOS appstore and the appstore cumulative rating of 4.4/5. AppSupports Safety Score for Fibonacci Stock Chart - trading signal in stocks is 84.0/100.
Should I download Fibonacci Stock Chart - trading signal in stocks?
✅ There have been no security reports that makes Fibonacci Stock Chart - trading signal in stocks a dangerous app to use on your smartphone right now.
Fibonacci Stock Chart - trading signal in stocks Screenshots
Product details of Fibonacci Stock Chart - trading signal in stocks
- App Name:
- Fibonacci Stock Chart - trading signal in stocks
- App Version:
- 1.4.0
- Developer:
- Mobile Interactive LLC
- Legitimacy Score:
- 80.0/100
- Safety Score:
- 84.0/100
- Content Rating:
- 4+ Contains no objectionable material!
- Language:
- EN
- App Size:
- 20.86 MB
- Price:
- Free
- Bundle Id:
- com.mobileinteractive.fibonaccichartfree
- Relase Date:
- 23 January 2014, Thursday
- Last Update:
- 23 November 2016, Wednesday - 03:41
- Compatibility:
- IOS 8.0 or later
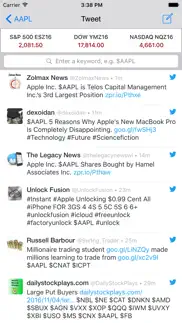
This app has been updated by Apple to display the Apple Watch app icon. 1. View watch-list quotes in 4 decimal places, great for penny stocks, bonds, and so on. 2. Add support to Twitter. Easily read tweets of stocks, reply tweets, post new tweets, ....