

- 17.0LEGITIMACY SCORE
- 18.5SAFETY SCORE
- 4+CONTENT RATING
- $9.99PRICE
What is SPL Graph? Description of SPL Graph 3994 chars
SPL Graph is an audio Sound Pressure Level (SPL) environmental noise analyzer, real-time frequency analyzer, chart recorder and data logger. It includes:
* Plot sound level over time
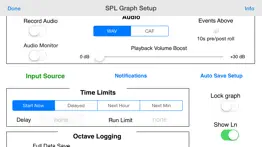
* Record audio while plot is running, playback to identify sounds that may have caused problems
* Capture video of events (optional in-app purchase)
* Do octave and 1/3 octave band analysis (optional in-app purchase)
* Show a 3D Plot of octave or 1/3 octave results
* Calculate Ln SPL values, L01, L10, L50, L90, L95, LMax and LMin
* Email notifications when sound exceeds pre-set limits
* Auto-save results after set intervals, and email the results to you
* Start another plot after auto-saving for continuous operation
SPL Graph works by averaging the SPL for a period of time that can vary from 0.1 second to 60 minutes, applying an optional weighting filter, and plotting the sound level, recording the raw audio signal, if recording is turned on.
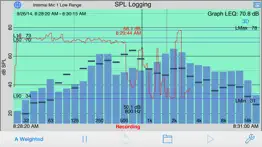
For sound intervals of 1.0 second to 60 minutes, the optional octave and 1/3 octave logging modules allows storing the spectrum of the sound, for each interval.
The app works very well with the built-in iOS device microphone. To upgrade the app to true professional standards, add our iTestMic, iPrecisionMic, or iAudioInterface2 with an appropriate microphone, and get ANSI or ISO Type 1 or 2 results. With iPrecisionMic, you can send the system in to our calibration lab and get a calibration certificate for ISO 61672 and ANSI S1.4.
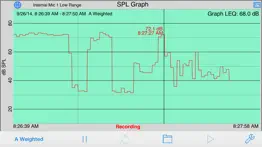
SPL Graph can record up to 24 hours of sound level data, with single second resolution. The graph starts with a one-minute plot window, and as a minute is recorded, the graph re-scales automatically and adds another minute to show the data collected so far. The overall SPL level, or LEQ, is displayed for whatever portion of the test is showing on the graph.
Tap the play button to play back the recorded audio, and you can use the cursor to scrub the audio location on the graph. Use this feature to listen to events that you can see on the graph.
With the optional octave logging module, you can also record the octave or 1/3 octave band levels. And, you can view the data on the 3D plot for a graphical view of frequency over time.
You can scroll and scale the graph vertically, in dB, by using standard swipe and pinch gestures. You can also scroll and expand and contract the time axis using gestures. Zoom out to a full 24 hours, or zoom in to a single minute, showing second resolution. Double-tap the screen to zoom out to show the entire graph on the screen.
The time scale grid changes dynamically, highlighting minutes, ten-minute, and hour lines as as it runs.
As the graph runs, the overall LEQ (average SPL) for the entire time period is computed and displayed on the screen. Swiping across the graph brings up a cursor that displays the exact dB level and time for any point on the graph.
You can turn on audio recording, so that you have a record of the sounds that were happening while the graph was being stored. You can use this to figure out exactly what the sound was that caused a peak on the graph, for example. Recordings can be compressed or uncompressed.
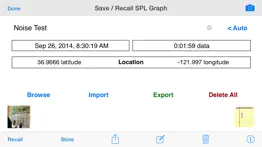
If you exit the app, or are interrupted with a phone call, the graph data will not be lost. SPL Graph will automatically save the graph, and reload it when you next open the program. You can also save a graph in one of ten files on the iPhone, so that you can recall the graph later.
SPL Graph supports saving graphs directly on your iOS device. You can recall these graphs and bring them up on the screen, and listen to the sounds that were made while the graph was recorded. You can also store an image of the screen to your photo roll. Use Dropbox or iTunes Files Sharing to export the results to your computer.
You can also export data in tab-delimited files for XLS import using iCloud.
The filters are all ANSI type 1 or better, and include A-weighting, C-weighting, and all octaves band filters from 32 to 16kHz.
- SPL Graph App User Reviews
- SPL Graph Pros
- SPL Graph Cons
- Is SPL Graph legit?
- Should I download SPL Graph?
- SPL Graph Screenshots
- Product details of SPL Graph
SPL Graph App User Reviews
What do you think about SPL Graph app? Ask the appsupports.co community a question about SPL Graph!
Please wait! Facebook SPL Graph app comments loading...
SPL Graph Pros
✓ Live Venue Aid!Great tool for finding "dead spots" while balancing systems! Giving me indicators where to aim speakers for even coverage. A+++ app. Can't wait for the interface!.Version: 0
✓ GreatGreat app I use it all the time for Pro Audio. The only thing that needs to be fixed is the naming of a memory, it doesn't work at all and when you save it to the photo roll it doesn't save the name either! It reverts back to SPL Graph 1 2 or 3! The other is in each different memory the LEQ isn't stored. If your want to get and average for each different song you can't because it continue to average across all memories. I understand that you may also want the average over all memories but both would be great..Version: 0
✓ SPL Graph Positive ReviewsSPL Graph Cons
✗ A Little Explanation Might HelpThis is a useful app, but has a number of rough edges: Every time the app is opened, a message appears that it is “now compatible with iTestMic.” But, when this box is clicked, one is taken to a 404 page for StudioSixDigital that says “Ever feel like you’re in the wrong place?” As 404 pages go, it’s a pretty nice one, but anything that results in a 404 doesn’t reflect well upon whatever causes it. Please don’t constantly put up a dialog box that the user cannot get rid of and when clicked results in a 404. The first time that this app was opened, it would not graph anything. It would appear to record sound, with a red “Graphing” a the center bottom, but… no graphing. However, when opened up a SECOND TIME, it appeared to work - at least for the first type of plot. (On an iPhone 6.) In the app description, there’s a very nice looking three-dimensional plot. However, I have not been able to figure out how to see any plot that resembles that one. I can only get a single step of plot: like the second one in the app description: a fine red line on a green background. (In this plot, the X and Y axes can be conveniently compressed or expanded by pinching and un-pinching.) Luckily, this single type of plot is what I need, so this is okay, but if the description is going to show three different types of plots, it would seem reasonable that the user could actually see all three types of plots. If the developer could address these rough edges, I would raise my rating, providing that the Apple iOS App Store allows such a thing..Version: 4.5.1
✗ Pants ManIf you try and use this any where remotly noisy, it won't work as the mic is not good enough on the iPhone. It would have been nice to have known this before I bought it, instead of getting the constant Clip message. This is why you only get one star. It's good to compare noise levels, but no good for accuracy. Sorry dudes..Version: 0
✗ SPL Graph Negative ReviewsIs SPL Graph legit?
SPL Graph scam ~ legit report is not ready. Please check back later.
Is SPL Graph safe?
SPL Graph safe report is not ready. Please check back later.
Should I download SPL Graph?
SPL Graph download report is not ready. Please check back later.
SPL Graph Screenshots
Product details of SPL Graph
- App Name:
- SPL Graph
- App Version:
- 8.4
- Developer:
- Andrew Smith
- Legitimacy Score:
- 17.0/100
- Safety Score:
- 18.5/100
- Content Rating:
- 4+ Contains no objectionable material!
- Category:
- Music
- Language:
- EN FR DE JA PL ZH SV
- App Size:
- 32.41 MB
- Price:
- $9.99
- Bundle Id:
- com.studiosix.LEQ
- Relase Date:
- 27 March 2009, Friday
- Last Update:
- 19 October 2023, Thursday - 20:58
- Compatibility:
- IOS 12.1 or later
-Updated for latest iOS devices and new iOS versions -Bug fixes and stability improvements.